
Grace built EcoMaps and reduced carbon emissions 🌱
Using Azure Functions Grace built a web app to compare routes based on their carbon emissions!
EcoMaps
About Me#
Grace Wilcox is a junior pursuing majors in computer engineering and electrical engineering with a minor in French. Originally from Columbus, Ohio, Grace is thrilled to be exploring the world of computer design and development, an interest of hers since middle school. This summer, Grace participated in the Serverless BitCamp, where she learned about Serverless functions, back end development using Node.js, and front end UI design with HTML, CSS, and JavaScript. She hopes to use these skills for a project she is leading through Case’s Undergraduate Student Government: a mobile application that will provide basic campus information like bus routes, dining hall menus, and an interactive campus map. In her free time, Grace enjoys playing the guitar, baking, and hanging out with friends and family.
The Premise#
Traveling somewhere? Know your carbon emissions.
Remember meeting your friends for dinner last week? How about your daily commute to work? Do you know how much gasoline you burned?
EcoMaps can help you know your carbon footprint.
Every day, people all around the world - including you and me - drive cars to work and school. Not only are cars needed for day to day life, they are also quintessential to the classic road trip, along with so many other recreational activities. Cutting cars out of our lives is clearly unthinkable, but it is important that each and everyone of us reflects upon the impact our lifestyles have on the environment.
Did you know that the typical passenger vehicle emits about 4.6 metric tons of carbon dioxide each year (1)? The accumulation of greenhouse gases like carbon dioxide in the atmosphere traps heat from the sun, causing the Earth to warm which, in turn, affects the climate (2).
Living a carbon neutral lifestyle may be near impossible, but being aware of how our daily lives affect climate change and adjusting our habits can make a huge difference - which is where EcoMaps comes in!
How does EcoMaps work?
EcoMaps is a web app that allows you to compare routes based on their carbon emissions. You simply need to provide your starting point and destination, and a bit of information about your vehicle, and EcoMaps will give you however many potential routes you desire, showing you the carbon footprint for each route.
Using route and map data from MapQuest’s API3, and carbon footprint estimation technology from the Carbon Interface API4, EcoMaps delivers reliable and accurate information. Microsoft Azure’s Function App5 is used to communicate between the APIs and UI webpage.
Why did I create EcoMaps?
As someone who has always been passionate about the environment, I knew I wanted to use my interest in programming to create something that actively fights climate change. Even though the climate crisis is too big for any one person to solve alone, the little actions of each and every one of us add up to make a huge difference, which is why I decided to focus on something that affects nearly everyone: transportation. Whether someone is planning a cross country drive or simply wants to evaluate their drive to work, I want them to be able to consider not only drive time or traffic, but their impact on the environment with each trip they take.
Ultimately, I hope to empower drivers to do their part in mitigating the climate crisis and protecting our beautiful planet that we call home.
Join me in saving the planet!
- (1) https://www.epa.gov/greenvehicles/greenhouse-gas-emissions-typical-passenger-vehicle
- (2) https://www.canada.ca/en/environment-climate-change/services/climate-change/causes.html
- (3) https://developer.mapquest.com/documentation/
- (4) https://docs.carboninterface.com/#/?id=getting-started
- (5) https://docs.microsoft.com/en-us/azure/azure-functions/
Tools used#
Back-end#
JavaScript
- Communicates with UI, APIs, and Azure Function
- Requests and displays makes/models drop downs
- Gets route information from MapQuest and sends distances to Azure function
- Receives and displays final emissions estimates
Azure Function App
- Node.js function that communicates with Carbon Interface API
- Sends route information, receives emissions estimates
- HTTP trigger called from main JavaScript function
APIs#
MapQuest
- API: Generates distances of routes using Alternate Routes request given start and end points
- SDK: Generates and displays routes on interactive map
Carbon Interface
- Request lists of makes and models for user selection
- Calculates carbon emission estimate for each route given distance and vehicle data
Packages/Libraries/Databases#
Node-fetch
- Sends http requests to the APIs
Front-end Languages#
HTML
- User input: text inputs for start/destination, select menus for makes/models, button for submission
- Output: table of routes and emissions data, interactive map via MapQuest SDK
CSS
- BootStrap used for styling of input, dropdowns, etc
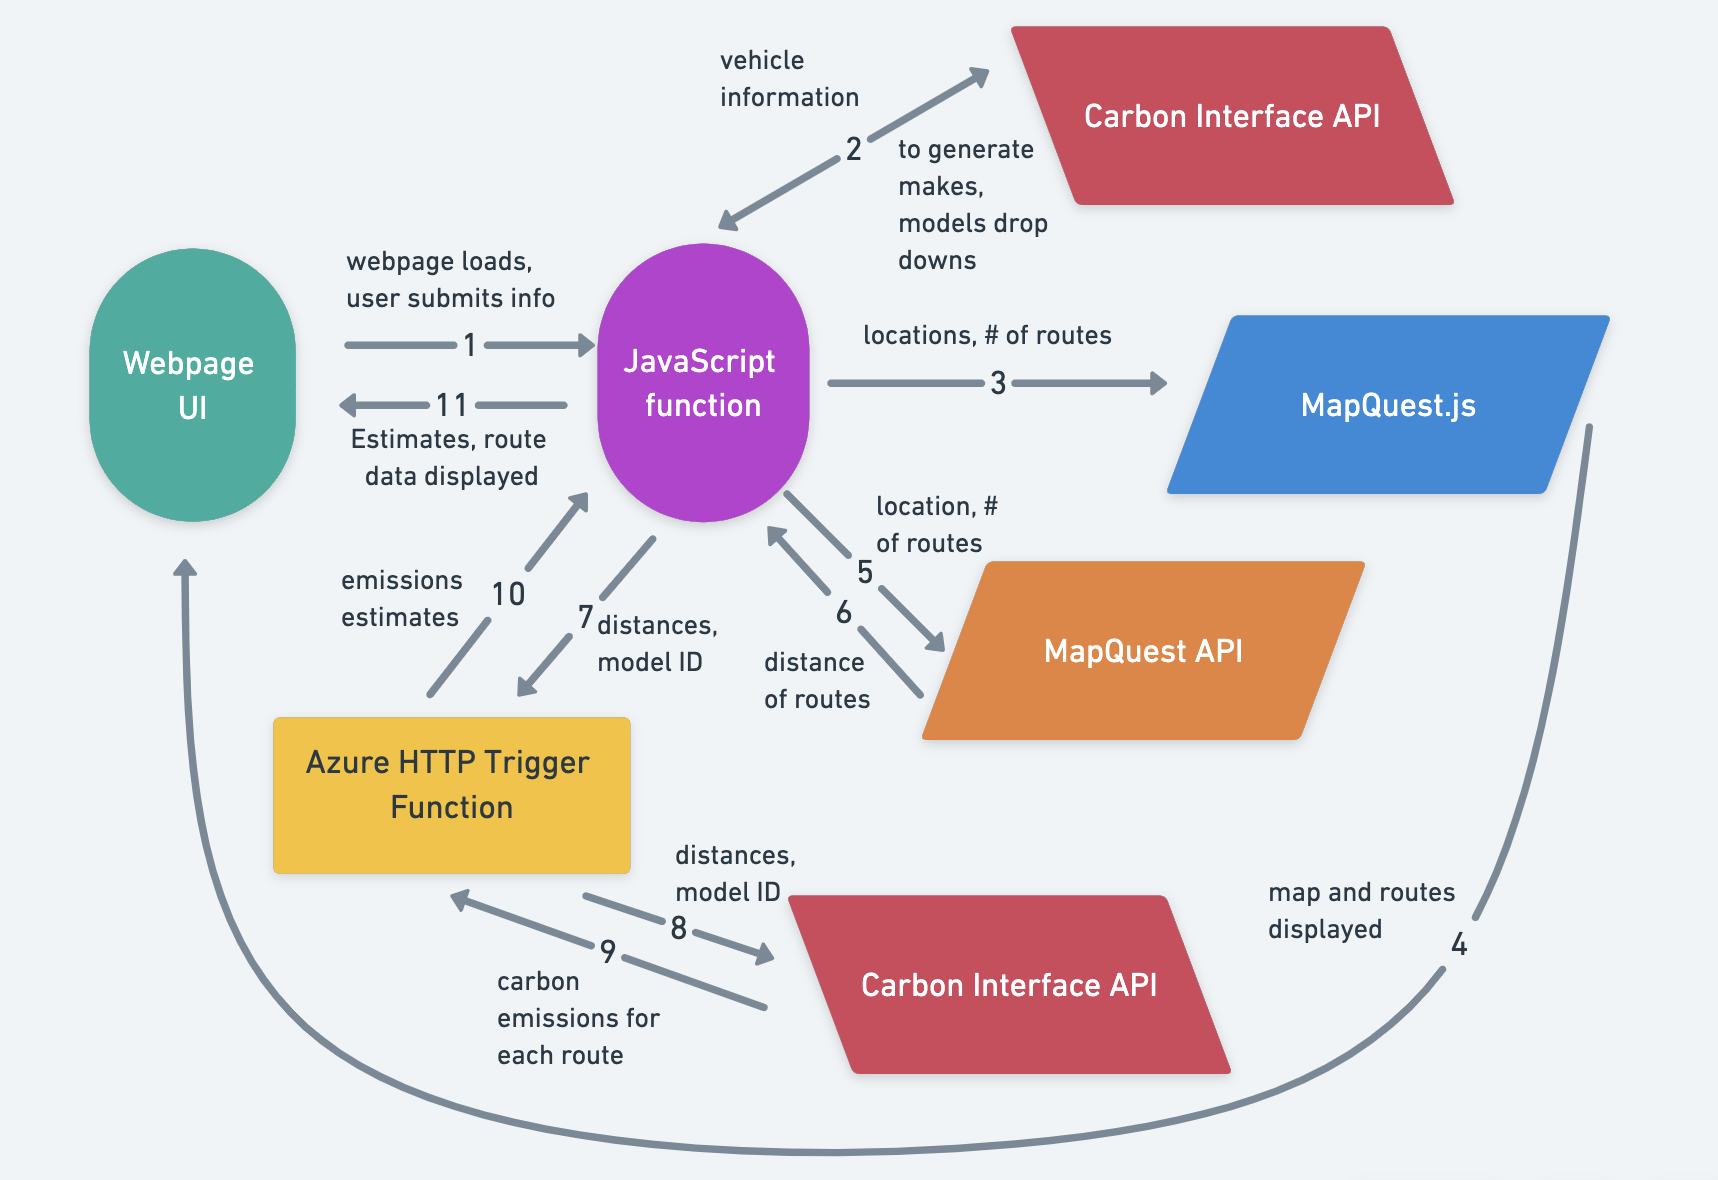
Flowchart#
When the webpage loads, the JS function retrieves the makes list and displays it to the page. The process is repeated with the models list once a make selection is made. Upon the submission of the vehicle information and starting and ending locations, the JS function sends requests to both the MapQuest SDK and API. The former generates and displays the routes directly to the webpage, while the API is simply used to get distance data, which is then sent to the Azure Function. The HTTP trigger function send emissions requests to Carbon Interface for each route, and then returns that data to the JS function. With all necessary data collected, the JS function updates the HTML page to display the routes and emissions in a table.
Links for resources:
- MapQuest API and SDK: https://developer.mapquest.com/documentation/
- Carbon Interface vehicle estimate: https://docs.carboninterface.com/#/?id=vehicle
Challenges + lessons learned#
BitCamp has been an incredible experience. I came into this program with a decent amount of programming experience, but with little knowledge of web app development. Through this camp I was able to learn so many useful technologies: JavaScript, Node.js, HTML, CSS, JSON. I got an introduction to how web apps work, what the difference is between using a server and Serverless functions, how to interface with an API via HTTP requests, all things that I hope to continue to explore in my career.
Not only did I grow on a technical level, but I also got to grow professionally as an engineer. I had to build my own project. From scratch. I had to come up with the concept, develop a plan on how to achieve my goals - which weren't deliverables assigned by professors - and then I actually had to implement that plan. I also had to deal with the times when things didn't go according to plan. The MapQuest API, for example, gave me and my mentor a run for our money. I rewrote that code a couple times, trying to find the right combination of the SDK and the API to make things work. And, despite the challenge, I am quite happy with and proud of my project.
Thanks and Acknowledgements#
I want to send a huge thank you to my mentor, Gopal Amlekar. He went above and beyond and was always doing his best to help me, whether it be with my project or just general engineering advice.
I also want to that all of the camp counselors at BitCamp. Shreya, thank you for your flexibility and answering my many questions. Daniel, thanks for letting me use your back-up GitHub account when this one got flagged (which is why this repo was built by danielkimtest, I did indeed write all of the code and do all of the work but just not on this account).